Streamingplot

Streamingplot is a tool that allows one to take some program which is printing
numerical information to stdout, and grab certain portions of it to plot in realtime.
Typical usage looks like
$ someprogram | streamingplotWhy would anyone want such a thing? I initially developed streamingplot because I was exploring some new languages (scala and later julia) and didn’t feel like investing the time upfront to learn a different plotting library. Since I’m quite familiar with matplotlib, it seemed natural to offload the work there. Later I realized it was actually a rather sane separation of duties. Plotting status information could happen in real-time, without sprinkling plotting code all throughout my scripts. The above image was generated using the following script
# file rwalk.py
from numpy.random import randint, randn
mat = [[0.0] * randint(2, 6) for i in range(6)]
while True:
    mat = [[x + randn() for x in row] for row in mat]
    print ';'.join(','.join(str(x) for x in row) for row in mat)
and then piping the output to streamingplot
$ python rwalk.py | streamingplotUsage
Most of the code I write is numerical and outputs pretty much the same two things to the terminal, either status messages (loaded data, doing this thing), or some metric to let me know what’s going on (log likelihood, accuracy, parameter norms, etc).
I decided to make the input format follow this idea as closely as possible.
All input to streamingplot is newline delimited into two types, either status messages or plot input. Status messages are echoed back to stdout and can have any form.
Plot input begins with PLOT_MARKER (defaults to >>), and is delimited by commas and semicolons.
Commas delimit data sources to be added to the same subplot, and semicolons delimit data for different subplots.
Here’s an example
>> 1, 2, 3; 4, 5; 6, 7, 8, 9;
>> 0.5, 1.5, 2.5; 3.5, 4.5; 5.5, 6.5, 7.5, 8.5;
some status message
>> 0, 1, 2; 3, 4; 5, 6, 7, 8;
another status message
This input defines a plot with three subplots, the first has three data sources,
the second two, and the third four. None of this information needs to be provided to streamingplot,
it simply assumes the first line that begins with PLOT_MARKER defines the input format.
You can change PLOT_MARKER using the -p flag. I’ve added a pretty significant amount
of options for defining labels, colors, etc. For example, if you include a file name at
the end of the call to streamplot, the final image will be saved to that name
$ someprogram | streamingplot img.pngI won’t outline all of the options here, the README on github contains a
fairly thorough explanation. Here’s some example output created using the
randomstream.py script in the github repo.

Use Case
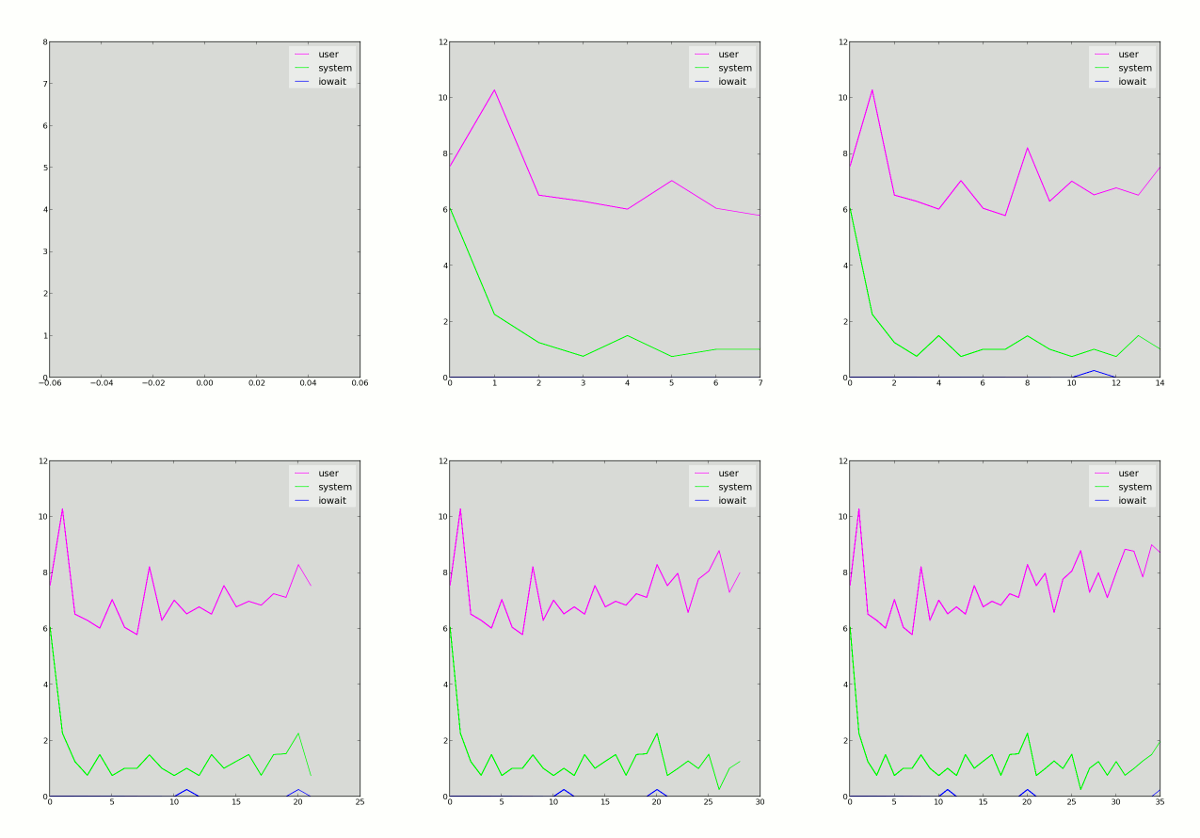
sar is a linux tool used to “Collect, report, or save system activity information.” It’s available as part of the sysstat package. sar has a lot of options, but by default prints CPU statistics. Typical output looks like:
$ sar 1
Linux 3.5.0-21-generic (glitchbox)  04/27/2014  _x86_64_ (4 CPU)

07:22:36 PM  CPU  %user  %nice  %system  %iowait  %steal  %idle
07:22:37 PM  all   2.53   0.00   0.76     0.00     0.00    96.72
07:22:38 PM  all   5.25   0.00   2.00     0.00     0.00    92.75
We can grab some pieces of the output using awk and then pass them along to streamingplot for visualization.
$ sar 1 | unbuffer -p awk '{ if ($3 == "all") {print ">> " $4 ", " $6 ", " $7}}' | \
  streamingplot -l "user, system, iowait" -c 'magenta, lime, blue'
I only recently started using awk, but it is awesome for doing stuff like this. Anyway, the result looks like

Weirdness and rough edges
Streamingplot started as a quick one off script and only later did I add enough to make it resemble a useful piece of software. It works for everything I’ve wanted to do with it, but there are certainly some rough edges. I may try to fix these at some point.
- If a plot line doesn’t follow the format (number of subplots, etc) inferred from the first plot line, streamingplot will just take as much of the data as it can without issuing a warning. This might be bad.
- Streamingplot redraws the entire plot every time. With lots of data this can be slow. I’ve tried to use the matplotib animation tools, but haven’t figured out a way to make it work like I want.
- I wanted to keep the arrangement of subplots as square as possible. This results in some wasted space occasionally. For example a plot with 7 subplots will yield a 3x3 grid with two empty subplots, rather than a 4x2 grid with one empty subplot.
- Streamingplot doesn’t expose many of matplotlibs options. No changing linestyles, labeling axes, etc.